ROC curves in machine learning
What is the ROC curve?
Receiver Operating Characteristic (ROC) curves are graphs that show the performance of a classifier by plotting the true positive and false positive rates. The area under the ROC curve (AUC) measures the performance of a machine learning algorithm. ROC curves visualize the statistical accuracy of classifier selection.1
Common categorization metrics for ROC curves in machine learning.
-
Specificity: A specific index of specificity, representing the ratio of the number of samples identified as negative by the model to the total number of negative samples.2
-
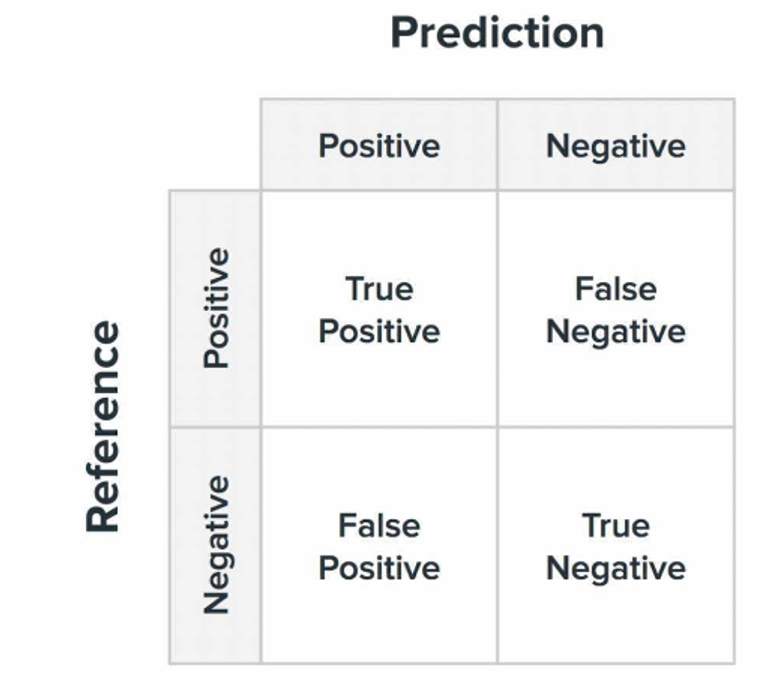
Confusion Matrix: Confusion matrices are visualization tools used especially for supervised learning, in unsupervised learning they are generally called matching matrices. In image accuracy evaluation, it is mainly used to compare the classification results with the actual measured values, and the accuracy of the classification results can be displayed inside a confusion matrix.2
The structure is shown below:

Figure 1: Confusion Matrix (image credit: https://blog.csdn.net/seagal890/article/details/105059498)
The parameters in the image are respectively:- True Positive (TP): The true class of the sample is positive, and the result of the model identification is also positive.
- False Negative (FN): The true class of the sample is positive, but the model recognizes it as negative.
- False Positive (FP): The true class of the sample is negative, but the model recognizes it as positive.
- True Negative (TN): The true class of the sample is negative, and the model recognizes it as a negative class.
-
Recall: The ratio of positive values to predicted positive values, also known as the check-all rate, recall shows how much the classifier can predict in an actual positive sample.2
Calculation formula:
Recall = TP/(TP+FN)
-
Precision: Also known as the precision rate, it indicates the proportion of samples that are truly positive in the model’s identification of positive classes. In general, the higher the check accuracy rate is, the better the model is.2
Calculation formula:
Precision = TP/(TP+FP)
-
Accuracy: Accuracy is the most commonly used classification performance metric. It can be used to indicate the accuracy of the model, i.e., the number of correctly recognized by the model/total number of samples. In general, the higher the accuracy of the model, the better the model is.2
Accuracy = (TP+TN)/(TP+FN+FP+TN)
How to draw ROC curves?
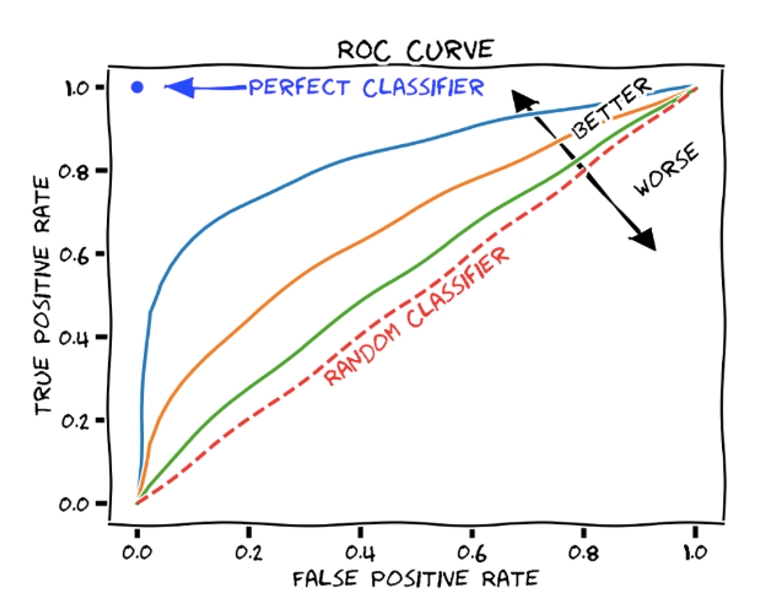
ROC curves can be generated by plotting True Positive Rate (TPR) on the y-axis of the graph and False Positive Rate (FPR) on the x-axis, which can help us to determine the efficiency of the machine learning model.
 “ROC Curve”
Figure 2: ROC Curve (Image credit: https://vitalflux.com/roc-curve-auc-python-false-positive-true-positive-rate/)
-
False Alarm Rate: Calculated as the ratio of negative samples that the model misidentifies as positive to all negative samples, generally the lower the better.2
Calculation formula:
FPR=FP/(TN+FP)
-
True Positive Rate: indicates the ratio of the number of samples that the model recognizes as negative class to the total number of negative class samples.2
Calculation formula:
TPR = TP / TP + FN
ROC Area under the curve
They are given a score based on the calculation of the area under the ROC curve (also known as AUC or ROCAUC) to compare the ROC curves of multiple classifiers. This score ranges from 0.0 to 1.0, where 1.0 is a perfect classifier. To calculate the AUC, we can use trapezoidal integration, which means first dividing the area under the ROC curve into trapezoids using the FPR and TPR values. The areas of these trapezoids are then summed to determine the AUC. The AUC is the average probability of how the model categorizes positive and negative responses.1
What’s the point of a ROC curve?
In machine learning, ROC curves measure the performance of various machine learning algorithms for categorization. Used in conjunction with AUC, ROC curves show how well an algorithm categorizes objects through the invariance of AUC when analyzing categories. ROC curves focus on finding the errors and strengths of the classifiers used to organize the categories, which makes ROC plots a useful analysis when comparing two categories, such as diagnostic tests that test for the presence or absence of a condition in a single category.1
Reference